Network Monitoring for Businesses: The 2026 Practitioner Guide
Florian Hödl
Network Monitoring and Automation
Summary: Network monitoring continuously tracks the state of connections, routers, switches, and services so that problems surface before they hit the business. One hour of network downtime costs an SME with 30 employees around €26,000 according to a German IT service provider's model calculation. The tools range from open source (Zabbix, LibreNMS) through commercial software (Checkmk from about €2,280/year, PRTG from about €1,650/year) to managed services (typically €50-150 per device per month in the DACH region). The real problem is rarely the tool: according to Vectra analyses, 63% of all alerts go completely unhandled because static thresholds create too much noise. Anyone introducing monitoring should plan alert quality from day one.
What is network monitoring?
Network monitoring is the continuous, automated observation of every component your data traffic depends on: internet connections, routers, switches, firewalls, WiFi, servers, and the services running on them. The system measures reachability, response times, utilisation, and error rates at short intervals, compares the values against the expected state, and alerts when something deviates.
The difference to a bare "is it still up?" ping lies in depth: good monitoring detects not just the outage but the degradation before it, the disk slowly filling up, the antenna with a falling signal level, the switch port with a rising error rate.
Why monitor? Downtime costs in numbers
The budget conversation about monitoring is usually held the wrong way round, about the cost of the tool instead of the cost of the outage. The current numbers:
- A German IT service provider's model calculation (hagel IT) puts one hour of downtime for an SME with 30 employees at around €26,000 in idle staff and lost revenue, closer to €30,000 once catch-up work and reputation damage are included.
- In the 2024 ITIC survey, over 90% of companies state that one hour of downtime costs more than 300,000 US dollars; for small businesses with a single critical server, ITIC conservatively calculates around 1,700 US dollars per minute.
- Mean time to recover differs drastically by preparation: 2 to 5 days without an emergency plan and monitoring, 2 to 8 hours with them - and with a 5G backup as failover path, the site bridges a line outage instead of sitting it out. A documented case of a Hamburg freight forwarder: 14 hours of ransomware downtime, 4 of which passed before the incident was even noticed, €380,000 in direct costs plus two lost major clients.
- Most frequent causes according to ITIC/Verizon reports: security incidents ahead of human error and misconfigurations, followed by ageing hardware and outdated firmware.
Those 4 hours until detection are where monitoring earns its keep. An outage first reported by a customer's phone call has the most expensive form of detection there is.
How does network monitoring work technically?
Three methods complement each other; none replaces the others:
| Method | Answers | Typical use | |
|---|---|---|---|
| SNMP / agents | How is the hardware doing? | CPU, memory, temperature, port status, error counters on routers, switches, servers | |
| Flow protocols (NetFlow, sFlow, IPFIX) | Who generates which traffic? | Finding bandwidth hogs, capacity planning, detecting unusual data exfiltration | |
| Synthetic monitoring | What does the user experience? | Automated outside-in tests: login, API call, page load from several locations |
The limits matter more than the datasheets: SNMP tells you that a port is at 100% utilisation, but not which application is saturating it; that takes flows. And all internal metrics can be green while nobody outside can log in; only the synthetic outside-in test sees that. For most SMEs, SNMP-based monitoring plus an external reachability check is the sensible core, with flows added once bandwidth questions come up.
The tools in 2026, compared honestly
We run our own monitoring platform on the Prometheus/Grafana stack and have encountered several of the following systems in customer environments. Prices are list prices, 2026, rounded.
| Tool | Cost | Strength | Honest weakness | |
|---|---|---|---|---|
| Checkmk | Community free; Pro from ~€2,280/year (~100 hosts) | Auto-discovery, 2,000+ plugins, strong on-premise | Conceptually demanding entry; APM and multi-tenancy only in Ultimate | |
| PRTG | 100 sensors free; from ~€1,650/year for 500 sensors | Fastest setup, intuitive UI | 2024 subscription switch with price increases above 120% in some cases; the sensor model gets expensive fast as you grow | |
| Zabbix | Software free, support/cloud paid | No limits, very light on resources, scales enormously | Steep learning curve; the web UI is notorious ("powerful, but complicated") | |
| LibreNMS | free | Best auto-discovery for pure network gear: IP + SNMP string is all it takes | Weak at server and application monitoring; dated UI | |
| Nagios / Icinga | free | Mature, huge plugin ecosystem | Feels antiquated in 2026; file-based configuration is tedious for small teams | |
| Prometheus + Grafana | free | Unmatched flexibility and dashboards; the cloud-native standard | No network monitoring out of the box: snmp_exporter, MIBs, and alerting must be built by hand | |
| ntopng | Pro from ~€300 one-off | Traffic analysis and top talkers at flow level | A complement, not a replacement for infrastructure monitoring; resource-hungry at high bandwidths |
Two patterns from practice: first, PRTG's 2024 pricing switch alienated many long-time users (verbatim from Reddit: "We still use PRTG, but without support, since they went crazy with their prices"); anyone choosing today should calculate the subscription over five years. Second, with the free tools the price is not zero, it sits in working time: Zabbix and the Prometheus stack reward teams who can invest the hours and punish everyone else.
The real problem is not the tool, it is alert quality
The industry's uncomfortable truth: monitoring rarely fails for lack of metrics, it fails from too many bad alerts.
- In the 2025 SANS Detection & Response Survey, 73% of organisations name false positives as their biggest challenge.
- According to Forrester, an analyst handles 174 alerts per day on average, of which only 22% justify a real investigation.
- Vectra analyses find that 63% of all alerts go completely unhandled.
The mechanism is always the same: static thresholds know no "normal". 80% CPU load is unremarkable during the nightly backup and a warning sign on Tuesday afternoon; a fixed limit treats both cases identically. Add the cascade problem: when a WAN link fails, every dependent service alarms at once and the root cause drowns in a storm of symptoms. Whoever gets alerted without reason too often goes numb, and then misses the one alert that counts. Why we build monitoring around context instead of thresholds is described in detail here: Network monitoring that thinks.
What ML and AIOps actually deliver (and what is marketing)
"AI-powered" is on almost every monitoring datasheet in 2026. A sober look:
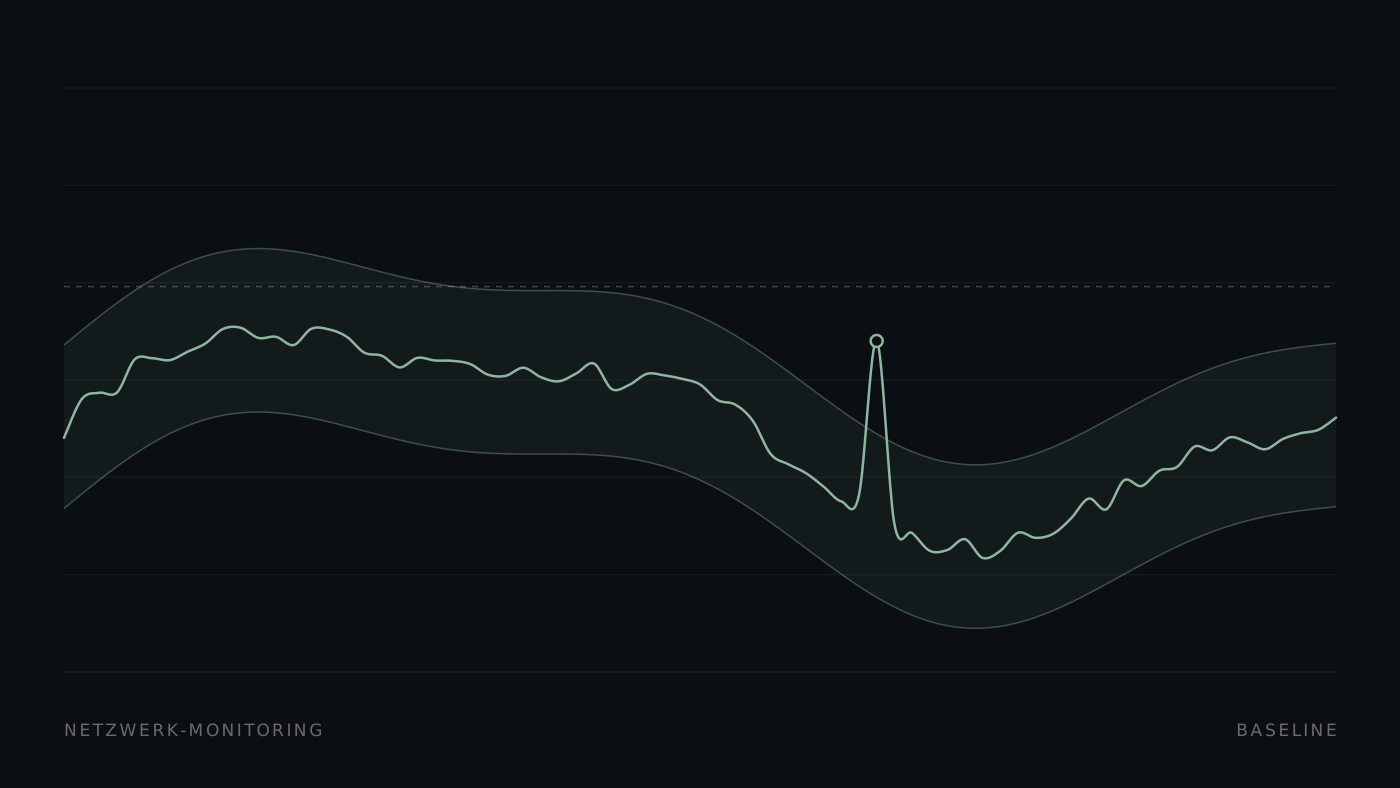
Demonstrably works: dynamic baselines instead of fixed limits (the system learns what is usual for each device at each time of day), event correlation (hundreds of related messages become one incident), and measurably less noise as a result. Forrester reports up to 85% alert reduction in the first year and around 60% shorter MTTR on average with seriously implemented AIOps.
Remains marketing: out-of-the-box magic. ML models typically need 4 to 8 weeks of training in the specific environment before the baselines hold, and on fragmented or incomplete data, anomaly detection just produces a new kind of false positive.
From our own operation of 200+ connections across fibre, DSL, leased lines, and 5G we can confirm both sides. Our monitoring intelligence (internally ANXEngine) learns a separate expectation band per connection across the day, and it correlates at the level above: if twenty connections of the same carrier drop simultaneously, that is one message ("carrier incident, 20 affected") and not a reason to plan twenty field visits. Just as honestly: these patterns were not there after a week, they emerged over months of real measurement data.
Run it yourself or buy managed?
In SMEs the make-or-buy question is rarely decided by the tool price, but by two other items:
- Staff costs: a junior admin quickly costs €60,000 a year all-in, and monitoring is one side duty among many for them. Managed monitoring in the DACH region typically runs at €50-150 per device per month depending on device type and SLA; a real 24/7 SLA adds roughly 30-50%.
- The weekend question: who reads the alerts on Saturday night? Monitoring without a defined escalation path and binding response time is a dashboard, not insurance. Phrases like "repair within a reasonable period" are legally worthless; insist on concrete response times.
- The underrated part of the service: a good provider takes over not just the tool but the alert tuning, which is exactly the problem from the previous section. You do not get a thousand messages forwarded, you get the one that means action is needed, with context on what to do.
Self-hosting pays off when in-house Linux and network expertise exists and someone permanently owns the upkeep. In every other case the managed per-device price usually beats an honest full-cost calculation of running it yourself.
Where to start: a pragmatic path
- Inventory: which connections, routers, switches, and servers are business-critical? For most SMEs that is a list of 10 to 50 devices.
- Base monitoring: reachability and core metrics (CPU, memory, disk, port status) on those devices, plus an external check on the outward-facing services.
- Escalation path: who gets notified when and how, and who covers for whom? Without this answer every alert is just an unread e-mail.
- Alert review after 4 weeks: go through every alert of the first weeks: was it justified? What was done? Anything that triggered no action gets muted or rebuilt. This one meeting separates working monitoring from an alert mailbox.
- Extend as needed: flows for bandwidth questions, synthetic tests for critical applications, anomaly detection once the data base stands.
How Anexum runs network monitoring
Anexum monitors 200+ connections for business customers as a managed service, from construction site links to company headquarters, on its own platform with learned expectation bands per connection, carrier correlation, and prioritisation by site criticality and SLA. Details are at Internet monitoring, and how it combines with connectivity and operations at Managed business internet.
Conclusion
In 2026, network monitoring is mandatory for any business from its first critical connection onward; the downtime maths leaves little room for debate. The tool choice is the smaller decision: between Checkmk, Zabbix, PRTG, and the Prometheus stack, the system your team can maintain permanently wins. The bigger decision is alert quality, because monitoring whose messages nobody reads any more is worse than none at all: it produces a sense of safety that does not exist.
Frequently asked questions
What does network monitoring cost?
Open source tools like Zabbix or LibreNMS cost no license but ongoing working time. Commercial software starts around €1,650-2,400 per year (PRTG 500, Checkmk Pro/Cloud). Managed monitoring typically runs at €50-150 per device per month in the DACH region; a 24/7 SLA adds 30-50%.
Which network monitoring tool is the best?
For pure network gear with little effort: LibreNMS. For mixed infrastructure with a decent budget: Checkmk. For maximum control with existing expertise: Zabbix or Prometheus/Grafana. For a fast start on Windows: PRTG, with an eye on the subscription cost over five years. Without a team of your own: a managed service instead of a tool purchase.
What is alert fatigue?
Alarm numbness: anyone who keeps receiving unfounded alerts goes numb and eventually misses the real one. The numbers are drastic; according to Vectra, 63% of all alerts go unhandled. The remedies are learned baselines instead of static thresholds, event correlation, and a regular alert review.
Is ping monitoring not enough?
A ping detects the total outage, nothing more. The gradual degradation that precedes it (falling signal level, filling disk, rising error rate) is only visible to monitoring with real metrics. And that lead time is exactly the difference between planned maintenance and a lost day.